Maps and visuals that captivate
At DataPalette, we transform data into visuals that don’t just inform — they captivate. Our data visualization and cartography services bring clarity, beauty, and impact to your information, making it memorable and accessible.
From publication-ready maps and infographics for magazines, websites, and brochures to trailhead guides, travel maps, and scientific journals, we craft visuals that elevate your message and engage your audience.
Our services
Cartography
Beautiful Maps That Tell Stories
Publication-Ready
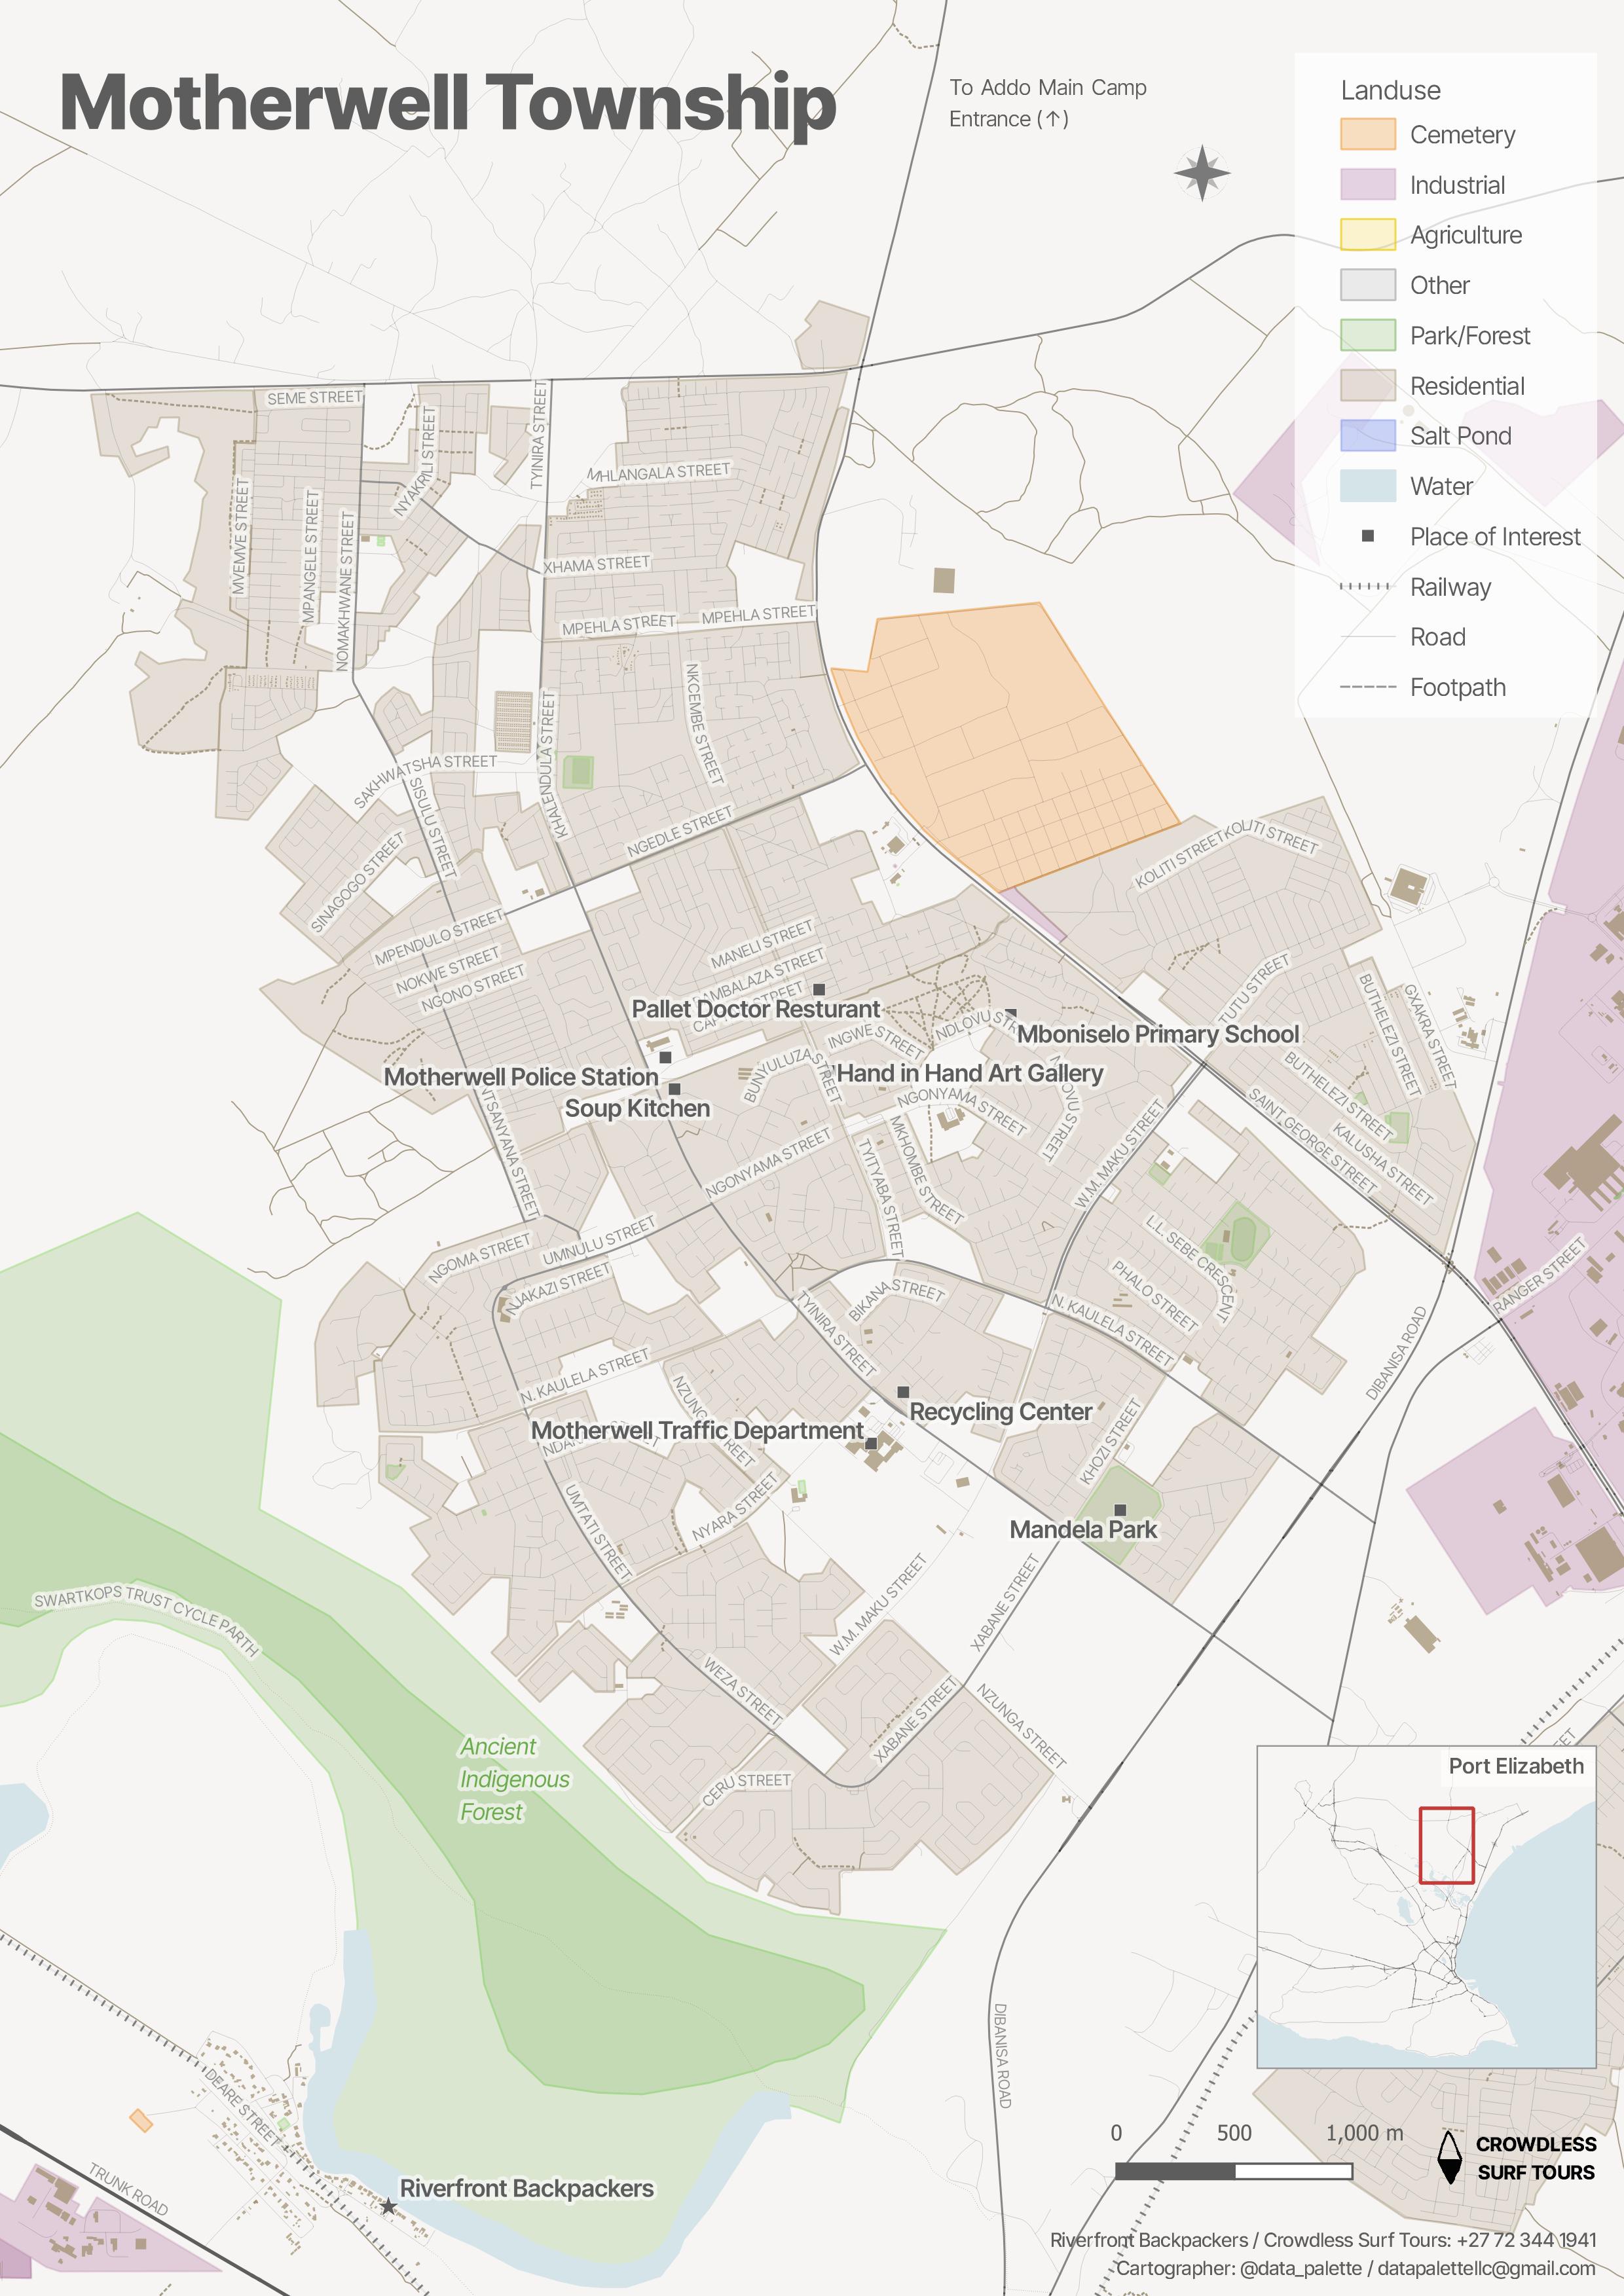
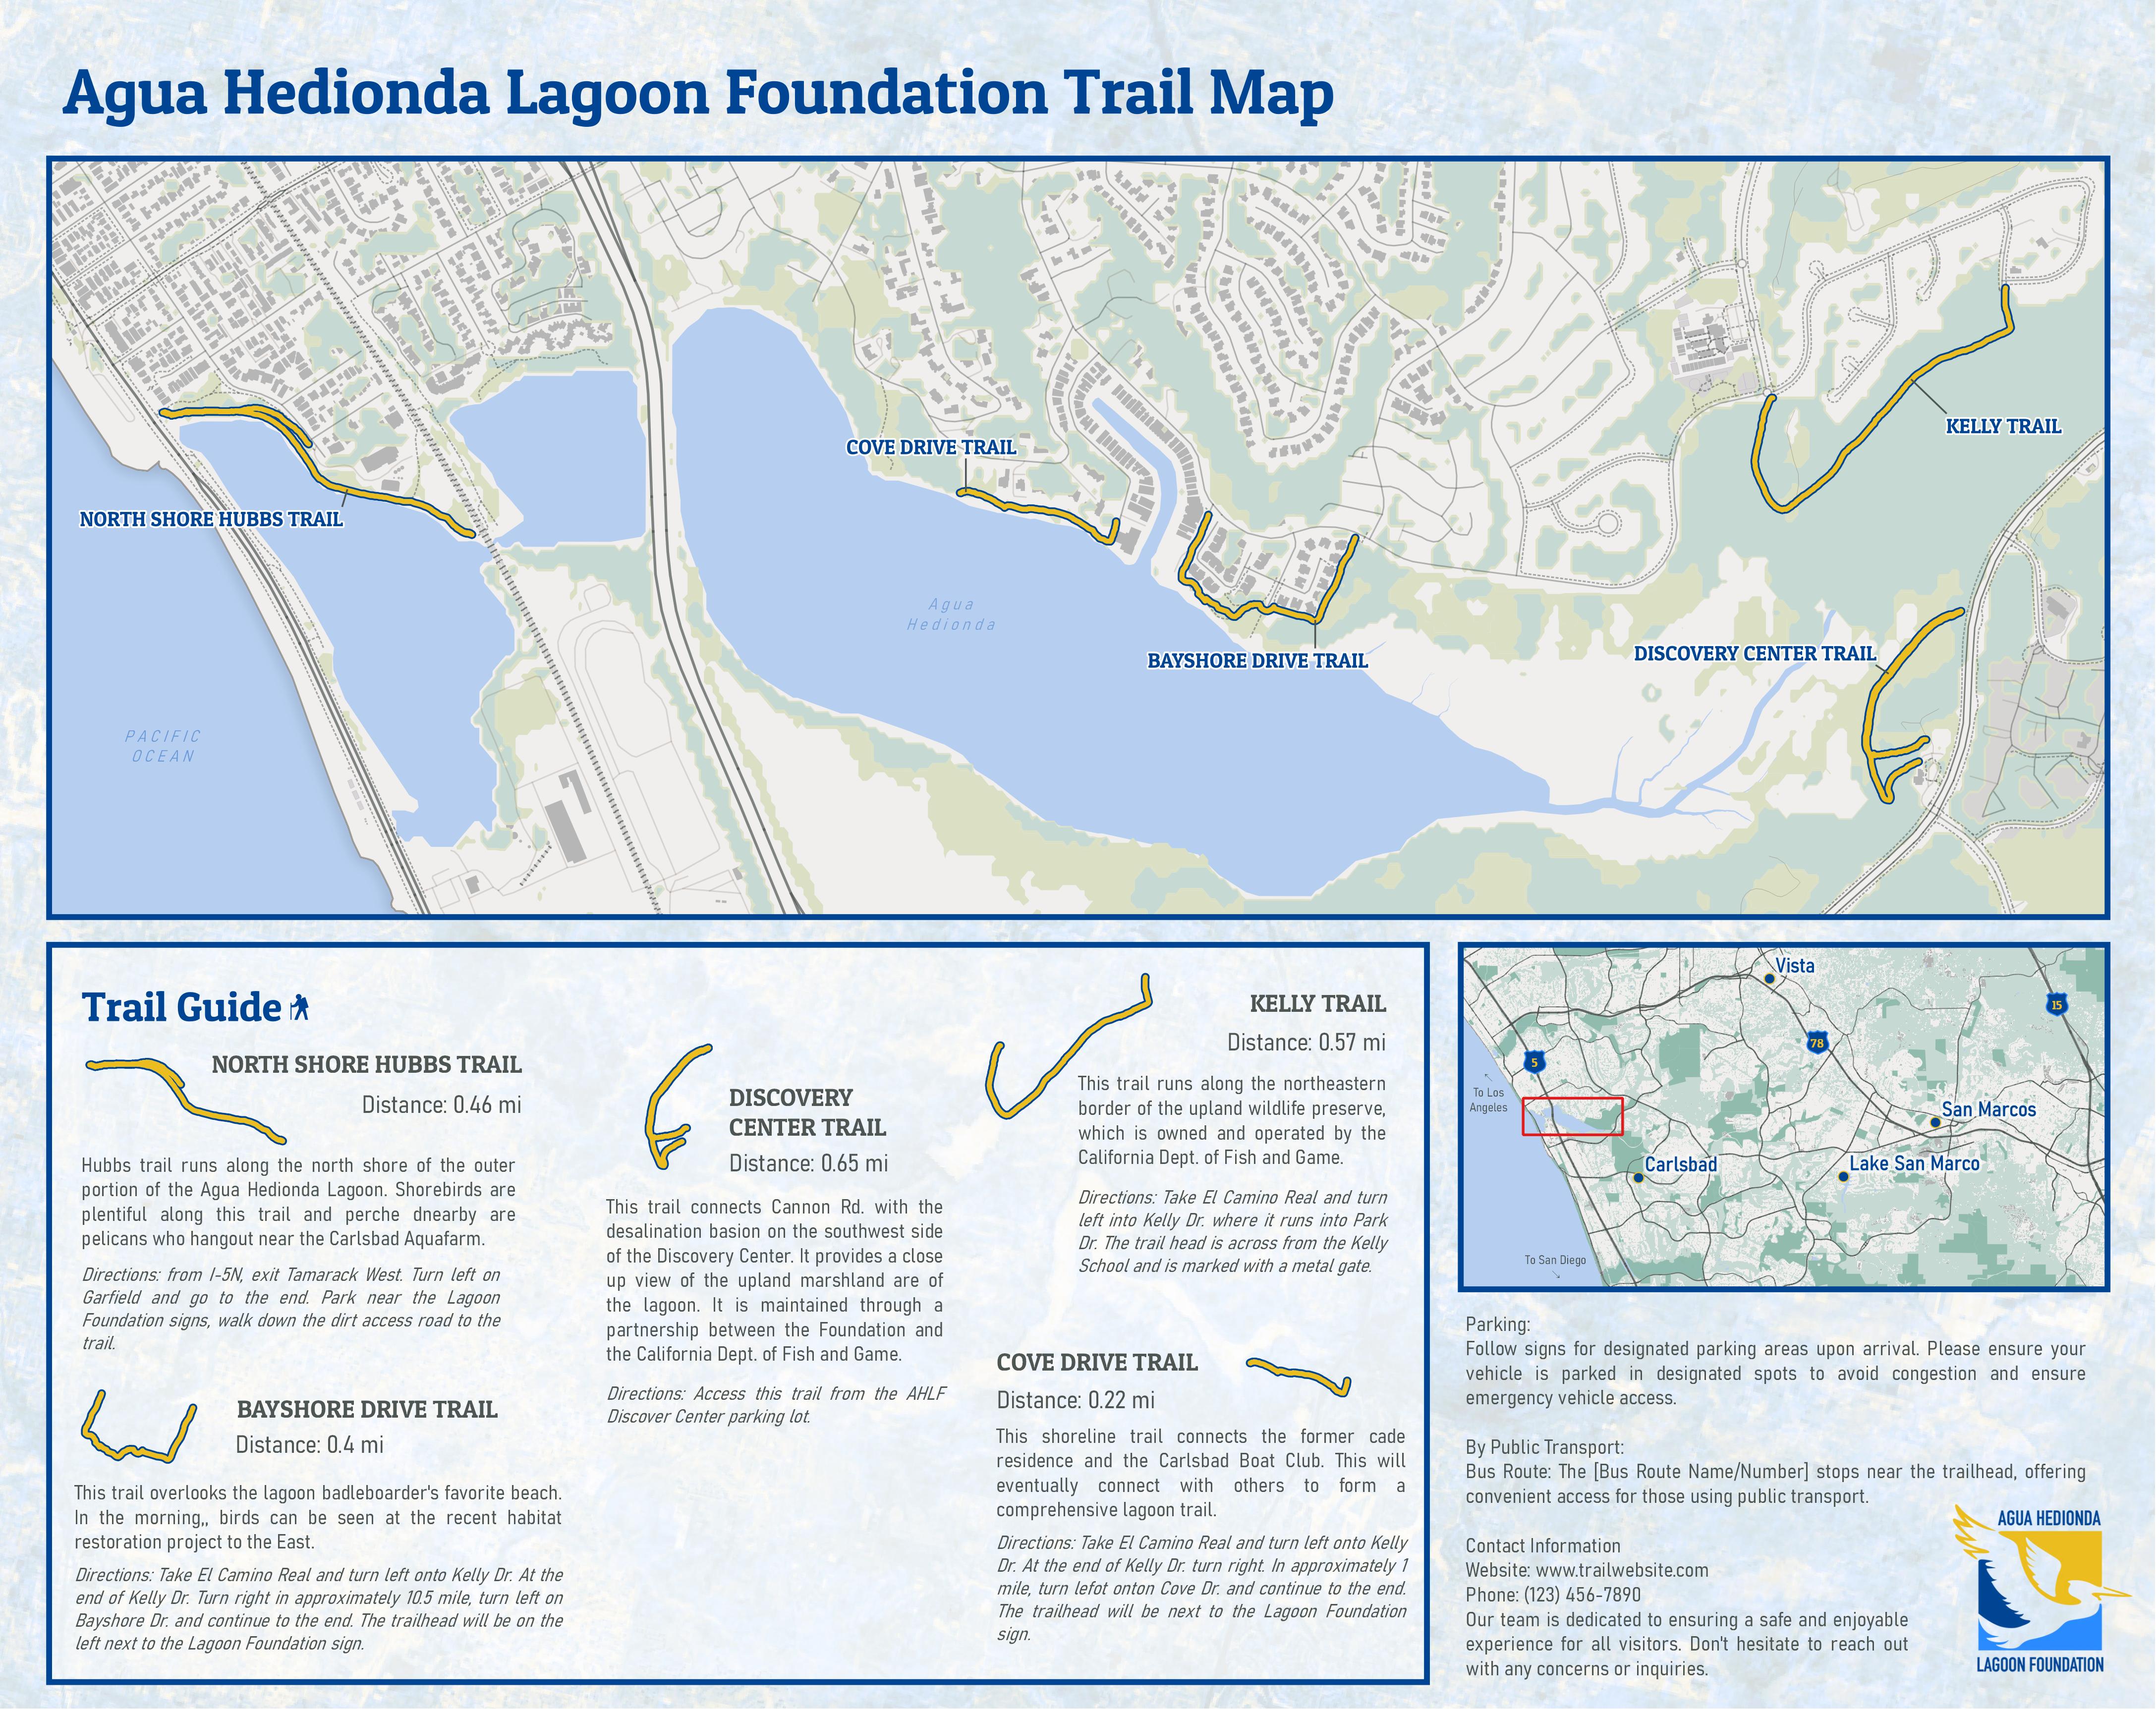
Crafted with precision, designed for impact. Our maps aren’t just beautiful—they’re ready to leap off the page and into the hands of your readers. From trail guides and 3D terrains to tourism brochures and scientific publications, each map is a masterpiece tailored for your narrative.
From Parks to Publications
Imagine a map that does more than locate—it captivates. From national parks and tourist attractions to strategic facility locations, our maps are crafted with a blend of artistry and science. Each product is designed to inform and inspire.
Maps with a Purpose
Whether you need a map of a hidden trail, a state park, or a bird’s-eye view of a cityscape, our maps are more than just visuals—they’re tools for discovery. Designed for clarity, accuracy, and style, our cartography makes complex information accessible and engaging.
Maps for Every Need
We design maps that go beyond the ordinary: trail maps, 3D terrain visuals, maps for tourism and scientific journals, or even unique souvenirs for tourist shops. Each map is meticulously crafted to reflect the story you want to tell.
Our services
Data Visualization
Turning Data into Design
Visualize the Unseen
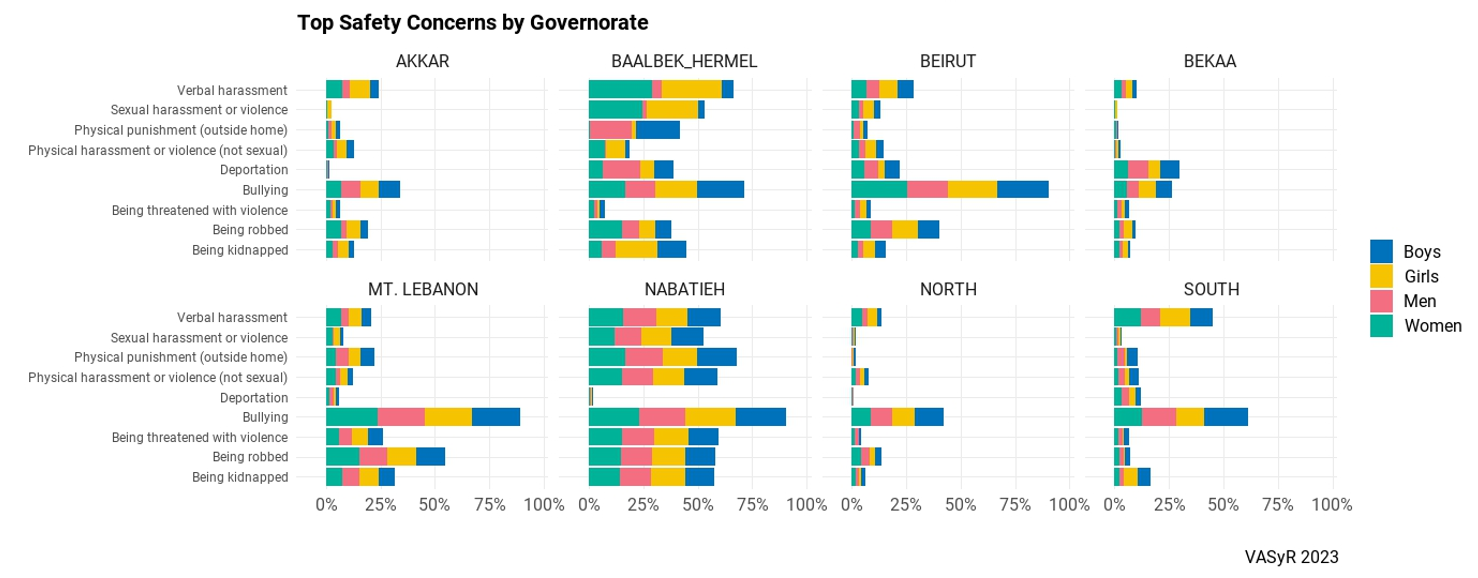
Turn raw data into compelling visuals that speak louder than words. From detailed infographics to complex data charts, our visualizations transform numbers into narratives that captivate, inform, and inspire action.
Visuals That Break Up the Noise
Our data visualizations are made to provide clear insights. We’ll help you find the right information to break up walls of text in reports, keeping readers engaged and improving how your story is communicated.
From Data to Design
Data doesn’t have to be dull. We create striking visuals that bring your data to life, making complex information clear and accessible. Perfect for reports, articles, and presentations that demand attention.
Data with Impact
Beautifully crafted charts, graphs, and infographics that turn your data into a powerful storytelling tool. We design with purpose, making your message clear, compelling, and impossible to ignore.